Image may be NSFW.
Clik here to view.
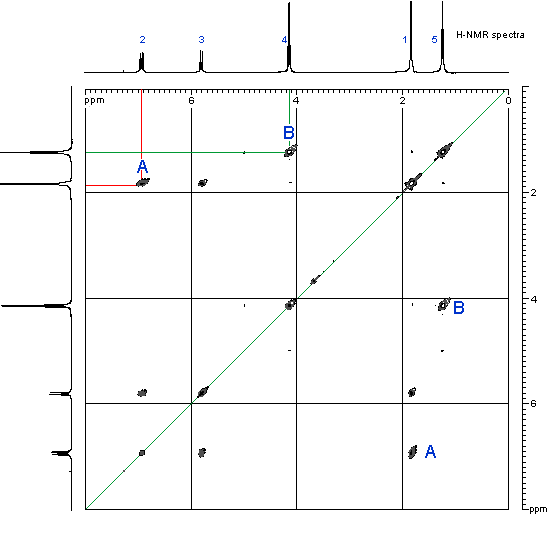
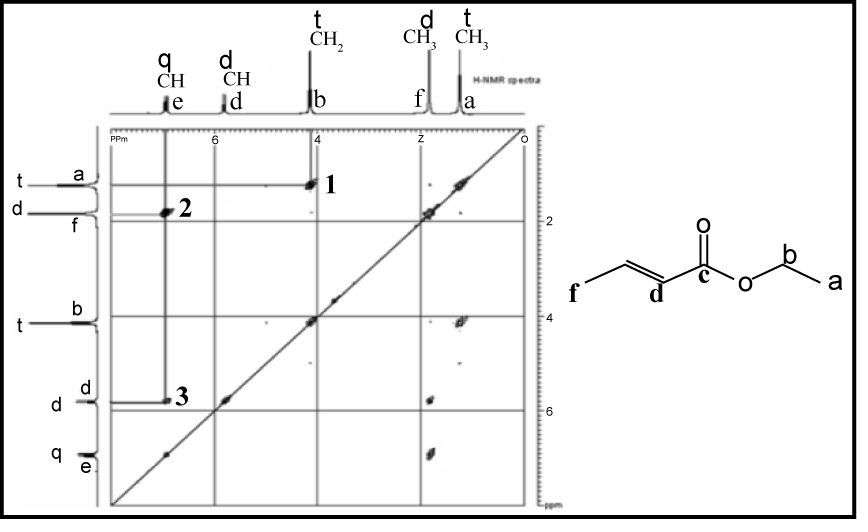
Ethyl-2-butenoate
Image may be NSFW.
Clik here to view.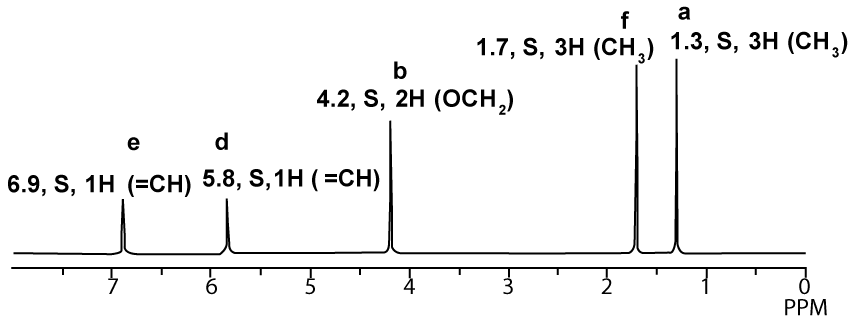
1H-NMR proton decoupled spectrum of Ethyl-2-butenoate in CDCl3.
Image may be NSFW.
Clik here to view.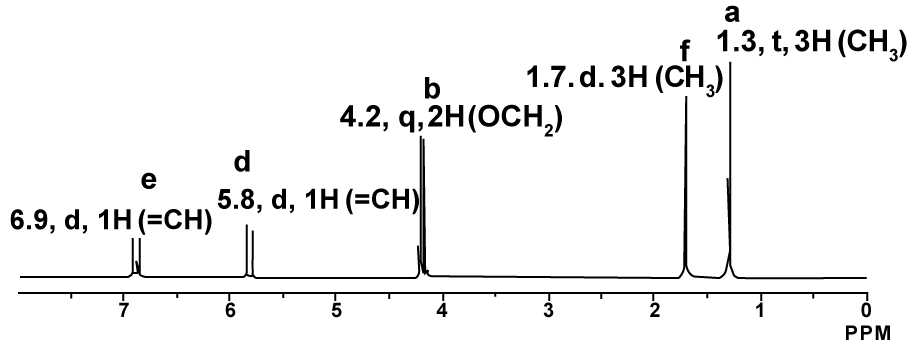
1H-NMR proton coupled spectrum of Ethyl-2-butenoate in CDCl3.
Image may be NSFW.
Clik here to view.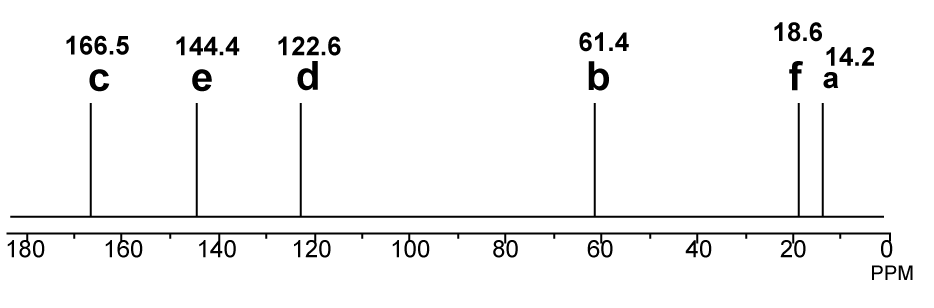
13C-NMR proton decoupled spectrum of Ethyl-2-butenoate in CDCl3.
Image may be NSFW.
Clik here to view.
DEPT spectrum of Ethyl-2-butenoate
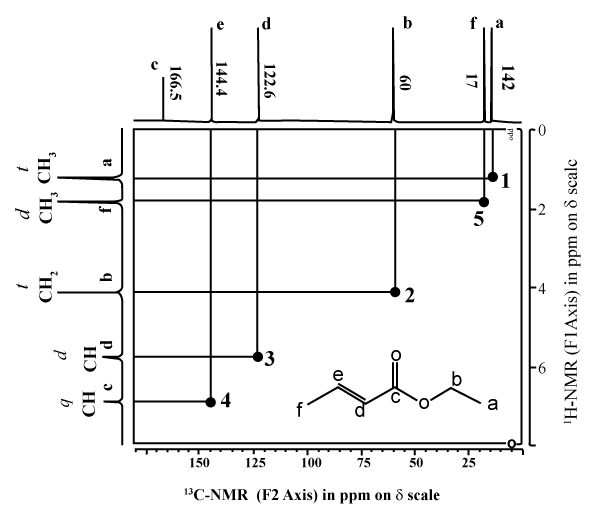
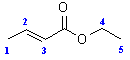
COSY spectra
- The information on the H that are coupling with each other is obtained by looking at the peaks inside the grid. These peaks are usually shown in a contour type format, like height intervals on a map.
- In order to see where this information comes from, let’s consider an example shown below, the COSY of ethyl 2-butenoate Image may be NSFW.
Clik here to view.
- First look at the peak marked A in the top left corner. This peak indicates a coupling interaction between the H at 6.9 ppm and the H at 1.8 ppm. This corresponds to the coupling of the CH3 group and the adjacent H on the alkene.
- Similarly, the peak marked B indicates a coupling interaction between the H at 4.15 ppm and the H at 1.25 ppm. This corresponds to the coupling of the CH2 and the CH3 in the ethyl group.
- Notice that there are a second set of equivalent peaks, also marked A and Bon the other side of the diagonal.
Clik here to view.
(COSY spectra recorded by D. Fox, Dept of Chemistry, University of Calgary on a Bruker Advance DRX-400 spectrometer)
Clik here to view.
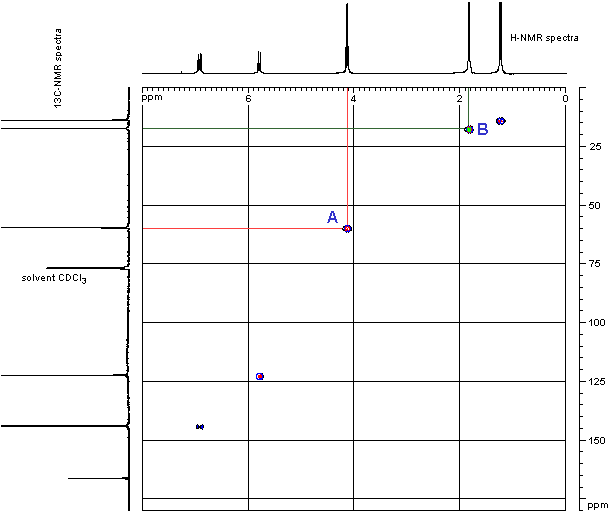
- The information on how the H are C are matched is obtained by looking at the peaks inside the grid. Again, these peaks are usually shown in a contour type format, like height intervals on a map.
- In order to see where this information comes from, let’s consider an example shown below, the HETCOR of ethyl 2-butenoate.
- First look at the peak marked A near the middle of the grid. This peak indicates that the H at 4.1 ppm is attached to the C at 60 ppm. This corresponds to the -OCH2- group.
- Similarly, the peak marked B towards the top right in the grid indicates that the H at 1.85 ppm is attached to the C at17 ppm. Since the H is a singlet, we know that this corresponds to the CH3- group attached to the carbonyl in the acid part of the ester and not the CH3- group attached to the -CH2- in the alcohol part of the ester.
- Notice that the carbonyl group from the ester has no “match” since it has no H attached in this example.
Clik here to view.
(HETCOR spectra recorded by D. Fox, Dept of Chemistry, University of Calgary on a Bruker Advance DRX-400 spectrometer)
Clik here to view.